How I Predicted the S&P 500 Low Using Mars-Jupiter Conjunction Cycles - Gann Time Cycle
- GannAstroTrader

- Jun 14, 2025
- 3 min read
While financial markets may appear chaotic at first glance, there exists an underlying rhythm governed by cycles of time and energy, rather than mere chance. Traders familiar with W.D. Gann’s teachings recognize that market reversals frequently occur when specific cosmic conditions align. Gann highlighted the impact of planetary motion, considering it not merely as symbolic indicators, but as tangible forces influencing time and price harmonics.
In this post, we examine how a significant low in the S&P 500 was anticipated using long-term Mars-Jupiter conjunction cycles. Before delving into this example, we will clarify the foundational concepts underpinning this approach.
Understanding Geocentric vs Heliocentric Perspectives in Market Forecasting
When analyzing planetary cycles, it is crucial to determine the perspective from which planetary positions are measured. There are two primary systems:
Geocentric: This approach observes planetary positions from Earth. It is the most commonly used method in astrology and aligns with many of Gann’s tools in relation to historical price action.
Heliocentric: This system measures planetary positions from the perspective of the Sun. It is often utilized to examine longer-term cycles with a more consistent rhythm.

In this study, we are employing the geocentric system because it focuses on how energy influences traders psychologically, aligning more closely with Earth-based, time-sensitive decision-making.
What Is a Conjunction, and Why Mars-Jupiter?
In astronomical terms, a conjunction occurs when two planets occupy the same zodiacal degree or come very close to it along the ecliptic. This event can be compared to two actors simultaneously stepping onto a stage. In market forecasting, conjunctions can create energetic shifts that frequently lead to high volatility or significant turning points.
This analysis specifically focuses on Mars-Jupiter conjunctions for the following reasons:
Mars symbolizes energy, aggression, and initiation, introducing action and acceleration into the markets.
Jupiter represents expansion, abundance, and confidence, often causing trends to extend further than anticipated.
When these two planets align, it often acts as a cosmic ignition switch, triggering strong directional movements in the market, especially if the alignment coincides with a previous major turning point.
The Mars-Jupiter Cycle and the S&P 500 - Gann Time Cycle
Let’s break down how this planetary alignment helped me accurately forecast a significant low in the S&P 500. It all began with the pandemic crash in early 2020. On March 23, 2020, the S&P 500 made a historic bottom. Interestingly, this date wasn't random. It coincided exactly with a Mars-Jupiter conjunction, a strong celestial signal suggesting a reversal was due.

After this conjunction, I tracked the market using a 360-degree cycle, a full planetary orbit. By the time the market topped out on January 3, 2022, it had covered almost 300 degrees of its Mars-Jupiter cycle. This was a critical marker because we’ve seen in past market cycles that approaching a full 360-degree loop often brings about a change in trend.
Then came the next big setup.
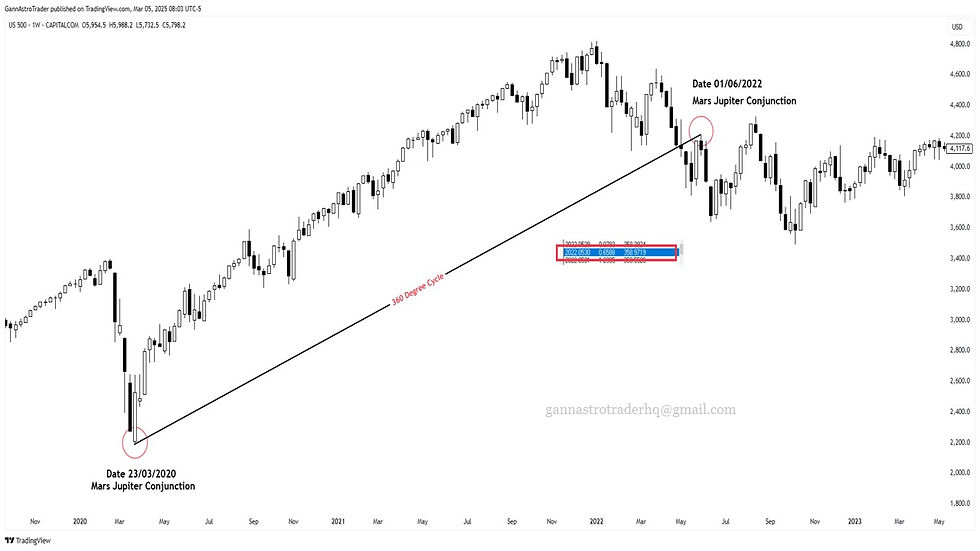
On June 1, 2022, Mars and Jupiter completed their first 360-degree cycle since the March 2020 bottom. Just weeks later, the S&P 500 made another important low and began reversing again. This pattern confirmed that the conjunction cycle was acting as a reliable timing tool.
But the most fascinating observation came from tracking two full Mars-Jupiter cycles, a total of 720 degrees. Based on my projection, the second cycle was due to end around August 18, 2024. Sure enough, the market began to dip approaching this date and reversed sharply upward on September 5, 2024, from a low near 5,100.


This reversal happened just after the cycle’s projected completion and occurred precisely at a long-term trendline, creating a perfect balance of time and price, the core principle in Gann’s methodology.
Why This Works: Time, Price, and Planetary Harmony
When the completion of the Mars-Jupiter cycle aligns with price factors such as trendline support and planetary influences like conjunction energy, the market often reacts decisively. This was precisely the case in this instance.
Furthermore, our analysis of historical charts by examining 360-degree Mars-Jupiter cycles in reverse revealed identical fractal behavior. This indicates that the market has historically responded in similar ways at equivalent cosmic intervals.
This type of setup is not speculative. It represents a synthesis of astronomy, cycle theory, and price behavior, as Gann advocated over a century ago.
Final Thoughts
Employing Mars-Jupiter conjunctions within the geocentric system offers a robust framework for predicting long-term market shifts. When these cycles align with price structures, such as trendline tests or previous swing zones, the likelihood of a market reversal significantly increases.
This example is merely one among many, yet it underscores the principle that timing holds greater importance than price. Moreover, when planetary cycles are utilized with precision, they can provide the advantage necessary to anticipate significant market movements.


